CKD stages and what they mean
Last reviewed November 17, 2026. OwieClear editorial team. Waiting for clinician review. Not medical advice. Talk with your doctor about your own care.
Stage is the first thing people are told and the thing they worry about most. It is only half of the picture.
Risk in CKD is set by two numbers together: how well the kidneys filter, and how much protein is leaking. A stage without the urine result is an incomplete answer.
Related pages: Chronic kidney disease
The bottom line
- Stages 1 to 5 are defined by eGFR: 90 or above, 60 to 89, 30 to 59, 15 to 29, and below 15.
- Stage 3 is split into 3a (45 to 59) and 3b (30 to 44).
- Albuminuria categories A1, A2 and A3 modify the risk at every stage.
- Stages 1 and 2 require evidence of kidney damage, because a normal eGFR alone is not disease.
- Rate of change over time matters as much as the current stage.
- Whether eGFR thresholds should be adjusted for age.
- How well risk equations perform in different populations.
- Whether the stage labels themselves cause unnecessary alarm in older adults.
The story, step by step
What the evidence labels mean
What each eGFR band means
What happens
Filtering, in millilitres per minute.
What the research shows
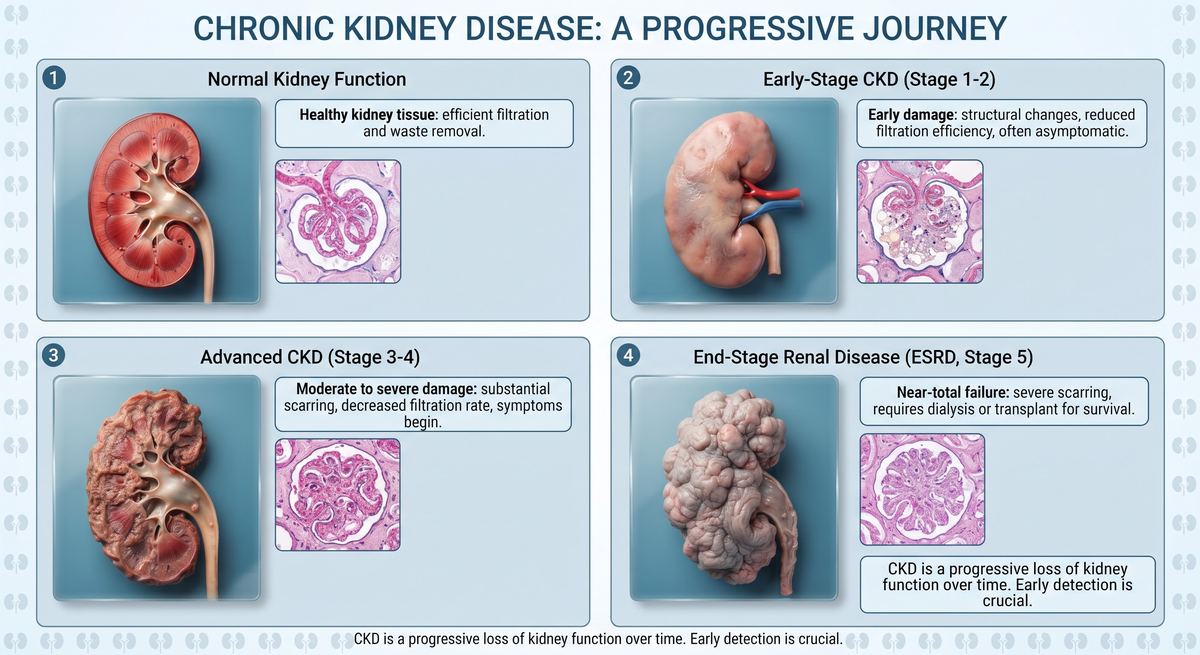
- Stage 1: eGFR 90 or above, with evidence of kidney damage such as albumin in the urine. Normal filtering, real disease.
- Stage 2: eGFR 60 to 89, again with evidence of damage. Without that evidence, this is simply normal for many adults.
- Stage 3a: eGFR 45 to 59. Stage 3b: 30 to 44. This is where most diagnosed CKD sits, and where complications begin to appear.
- Stage 4: eGFR 15 to 29. Severely reduced. This is when planning for possible kidney replacement begins.
- Stage 5: eGFR below 15, called kidney failure. Dialysis or transplant is considered, though not always immediately.
- eGFR is reported in mL/min/1.73m2, standardised to body surface area so numbers are comparable between people.
Why it matters
Being told stage 3 sounds alarming and is often stable for life, particularly in older adults with no protein leak. The stage number alone does not answer the question people are actually asking.
What's still uncertain
- Whether an eGFR of 50 in an 80-year-old should be called disease.
- How to communicate stage without causing disproportionate fear.
Read more
- KDIGO: CKD evaluation and management guidelineNonprofit
- NIDDK: Tests and diagnosis of chronic kidney diseaseGovernment
- MedlinePlus: Kidney testsGovernment
Next: The other axis
Albuminuria categories
What happens
A1, A2, A3.
What the research shows
- Albuminuria is measured as the urine albumin-to-creatinine ratio, in milligrams per gram.
- A1 is under 30, normal to mildly increased. A2 is 30 to 300, moderately increased. A3 is over 300, severely increased.
- The older term microalbuminuria corresponds roughly to A2, and is still seen on some results.
- Albumin leak reflects damage to the glomerular filter, and it appears earlier than any fall in eGFR.
- It is also one of the strongest predictors of progression and of cardiovascular events, independent of eGFR.
- It responds to treatment. A fall in albuminuria after starting an ACE inhibitor or SGLT2 inhibitor is a good sign.
Why it matters
The urine test is the one that is most often skipped and the one that carries most of the prognostic information. A stage without it is half an answer.
What's still uncertain
- Whether reducing albuminuria causes better outcomes or merely marks them.
- The best target for albuminuria reduction.
Read more
- KDIGO: CKD evaluation and management guidelineNonprofit
- NIDDK: Tests and diagnosis of chronic kidney diseaseGovernment
- NIDDK: Diabetic kidney diseaseGovernment
Next: The grid
How the two combine
What happens
Risk, not just stage.
What the research shows
- Guidelines combine eGFR stage and albuminuria category into a grid, colour-coded from low to very high risk.
- Stage 3a with A1, no protein leak, sits in the moderate band and often stays stable for years.
- Stage 3a with A3, heavy protein leak, sits in the very high band and needs close follow-up and treatment.
- The grid determines how often to monitor, when to refer to nephrology, and how aggressively to treat.
- The cause of the kidney disease is the third element, because the same numbers mean different things in diabetic kidney disease and in polycystic kidney disease.
- Guidelines refer to this as the cause, GFR and albuminuria framework.
Why it matters
Two people can share a stage and have completely different outlooks. This is why a single number from a results portal should not be read on its own.
What's still uncertain
- How well the grid predicts risk at an individual level.
- Whether adding other markers would improve it.
Read more
- KDIGO: CKD evaluation and management guidelineNonprofit
- NIDDK: Chronic kidney diseaseGovernment
- NIDDK: Tests and diagnosis of chronic kidney diseaseGovernment
Next: Over time
The slope matters
What happens
Direction beats position.
What the research shows
- A single eGFR is a snapshot and can be affected by hydration, recent illness, and a protein-heavy meal before the test.
- What matters clinically is the trend over months and years. A decline of more than about 5 per year is considered rapid progression.
- Normal age-related decline is roughly 0.5 to 1 per year after about age 40, which is why older adults commonly sit in stage 3a without progressive disease.
- A sudden fall usually means something acute: dehydration, an infection, a new medicine, or an obstruction. It should be investigated rather than assumed to be progression.
- Risk calculators estimate the probability of kidney failure within two and five years using age, sex, eGFR and albuminuria.
- These tools are used to decide on referral and on when to start preparing for kidney replacement therapy.
Why it matters
Asking for the last few years of results rather than the latest one changes the conversation from a label to a trajectory.
What's still uncertain
- How many measurements are needed to establish a reliable slope.
- How well kidney failure risk equations perform across populations.